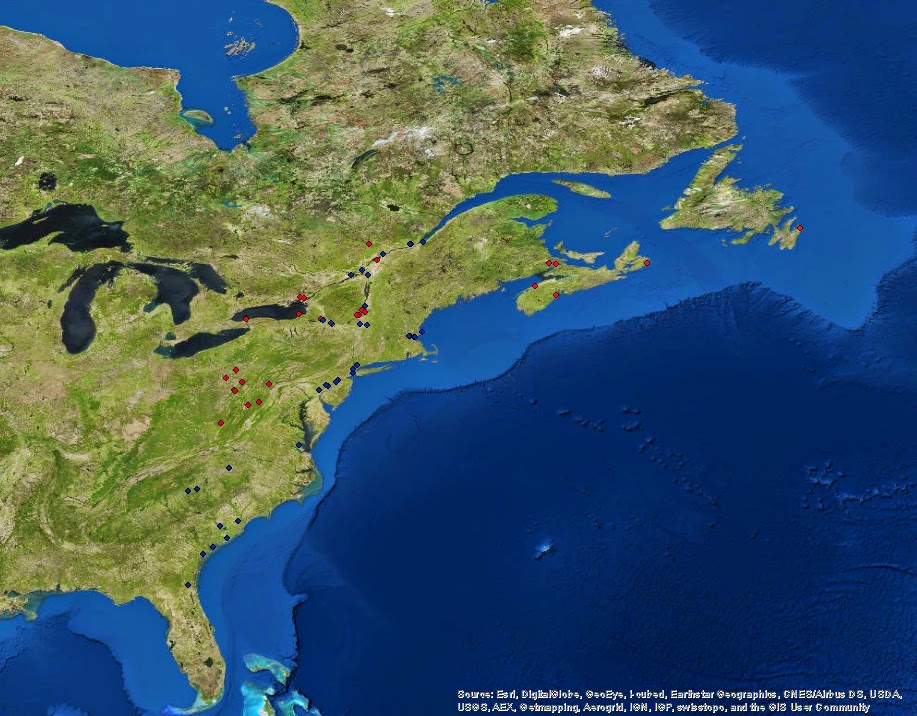
Last week more points representing Revolutionary war battles were added to the excel spreadsheet. For the map, the points were selected by the war they belonged to and color coded to differentiate each battle between the French and Indian War and the American Revolution. The red points represent the French and Indian War while the blue points represent the American Revolution. These colors are only a temporary change used to keep the points organized into categories. Later I plan on coming up with a better set up for categorizing the points either based on the war they belong to or their outcome. This week I will try to add more points to finish up the Revolutionary War and move on to the War of 1812 as well as focus on an efficient way to design this map so that it is interactive and easy to follow. A series of different symbology shapes for each pint as well as color will most likely be used to display the final sets of points for each war in the future.
Your map is looking good. You seem to know what you want to do with you map. Keep up with the good work!
ReplyDeleteThe map looks really good so far, the colors are looking good too so you can differentiate the wars. I think you should make the points a little bigger and then maybe make the background transparent so the points are more visible.
ReplyDeleteOverall it is looking really good!
I like how you have them color coordinated, it's much easier to see the different battles. I would increase their size and maybe use different icons/symbols eventually to depict large battles or battles of interest. And the detail of the map is a bit distracting. Maybe use a solid color with borderlines or something a bit less straining on the eyes to find those points. Other than a few nitpicky things, it looks like its coming together really nicely. Keep it up!
ReplyDelete